
Well I guess I let the cat out of the bag with the title. If we look at the last 100 years of baseball, there has been a steady increase in the percentage of all complete games thrown that were also shutouts. Let’s jump right in to the data:
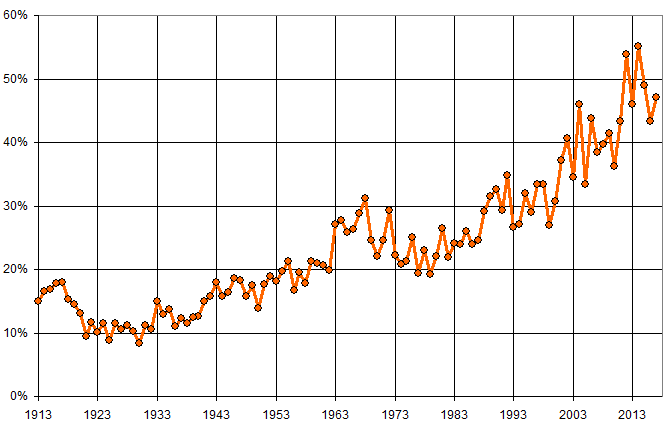
As you can see, up through about 1950, it was always the case that less than 20% of all CGs were shutouts. This is largely because most starts ended up as complete games, even by the losing pitcher. Take 1913, when a total of 1,234 MLB games were played. This represents 2,468 games by starting pitchers, and a total of 2,066 of these started were completed. That’s a whopping 83.7% of starts resulting in a CG, and obviously by definition no more than 50% of all CGs can be shutouts every game has a winning team that scores at least 1 run (lets ignore ties, shall we?).
So it’s not surprising that the overall percentage of CGs that were SHOs was low back then. It was also customary to simply let the starting pitcher stay in the game unless he was getting murdered.
In 1963, there’s a dramatic spike, where the percentage of complete games that were shutouts rose to 27.0% from just 19.9% in 1962. This is primarily because overall scoring dropped dramatically that year, from 4.46 runs per team game in 1962 to just 3.95 in 1963. Lower scoring means more shutouts and thus a higher percentage of games ending with zero runs.
The 1960s remained a good decade for pitchers, and we see a peak in 1968, the Year of the Pitcher, when the percentage of CGs that were SHOs crossed 30% for the first time. Then, come the age of the designated hitter in 1973, the percentage dropped at offense increased.
Since 1973, the percentage has increased at an even higher rate than it did for the first half of the 20th century. We notice a drop in 1993, the beginning of the Steroid Era, when shutouts became rare. But the overall trend upward, which finally crossed 50% in 2012, must also be due to an increased tendency for managers to reliever starting pitchers when they give up a run. In other words, a dominant starter who allowed just 1 run is substantially more likely to be removed from a game than a guy pitching a shutout. Another way to look at this is that a starter who is holding on to a shutout is more likely to be given a chance to finish the game but then be pulled if he allows a run.
Another thing to note–as the years progress, there is more noise in the data. Before the 1960s, the average year-to-year change was about 1.8 percentage points. Since then, the average change is more than 4 percentage points. There’s a basic statistical reason for this–complete games are much less common and therefore rates like what we calculated here are far more subject to random fluctuation.
Remembering that more than 80% of all starts were complete games in 1913, check out the same data for 2016: 2,428 MLB games meant a total of 4,856 starts, and just 83 of those were completed. That’s just 1.7%–such a small number, no wonder there’s all kinds of small sample size noise.
Thanks to @cyan_sunshine for helpful discussions in developing this idea. Featured image is 2017 Topps Now MLB card #119, commemorating Scott Feldman’s complete game shutout.