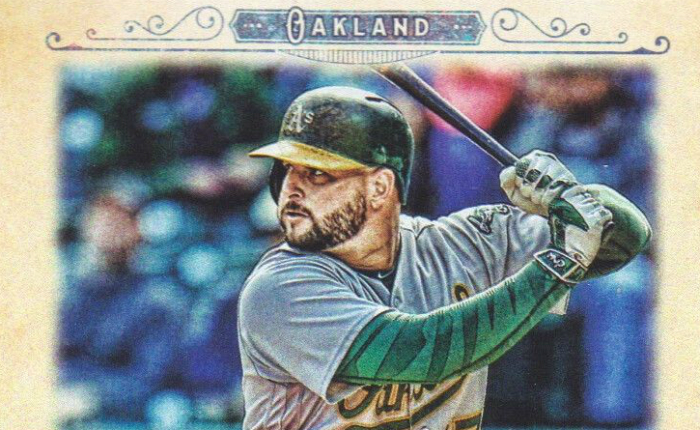
Yonder Alonso, first baseman for the Oakland Athletics, has been doing incredible things in the first weeks of the 2017 season. With 32 games in the rear view mirror, Alonso has guaranteed certain career highs and has set a trajectory for several others.
Alonso is currently ranked within the top 10 among American League players in position player WAR (1.5), slugging (.687), total bases (68), home runs (11), adjusted OPS+ (200), extra base hits (16), AB per HR (9), oWAR (1.6), OPS (1.076), doubles (39), RBI (27), and several defensive stats. In short, he’s doing very well.
Previous to 2017, the most home runs Alonso ever hit in a full season was nine during his rookie year in 2012 and, at 11, he is on pace for 52. Obviously the odds of Yonder Alonso hitting 52 home runs in one season are pretty slim — he is going to slump eventually — but the fact that he is even on pace for that type of production is a career high in itself.
Excluding 2010 and 2011 when he had combined total of 127 plate appearances, let’s take a look at the number of plate appearances he made for every one home run he hit.
2012 – 68.77
2013 – 62.5
2014 – 41.14
2015 – 80.4
2016 – 76
2017 – 10.27
If Yonder Alonso only hits four more home runs in this season and can reach last year’s total plate appearances, he will still have cut his best ratio nearly in half. For comparison, teammate Khris Davis, who finished third among AL home run hitters with 42 in 2016, had a ratio of 14.52 (his ratio this year is 13.9, in case you were wondering) so in terms of home runs as well as per at bat ratio, Alonso has already secured a career year.
Home runs are not the only measure of a hitter, though. Taking a look at his plate appearances per walk rate, we can see a trend towards better plate discipline.
2012 – 9.98
2013 – 11.71
2014 – 16.9
2015 – 9.57
2016 – 11.82
2017 – 8.07
With a walk coming once in, roughly, every eight plate appearances, Alonso is on pace for around 66 walks. This is a more realistic possibility that would likely place him in the top 20 among AL hitters. In 2016, Kole Calhoun walked 67 times (ranking 15th on the year) with a ratio of 10.02. Further, Alonso walked 62 times in 2012 so his patience isn’t an anomaly but a welcome trend from last season.
In terms of striking out, which is a metric with much less negativity than a decade ago, Alonso is continuing a two season downward trend.
2012 – 6.12
2013 – 7.97
2014 – 8
2015 – 8.37
2016 – 7.18
2017 – 4.7
With the thinking behind strike outs shifting toward unimportant, take this stat with a grain of salt. Hitters in today’s game aren’t trying to avoid the K like they once did and numbers are on the rise among many of baseball’s best hitters. The strike outs aren’t at a point where it’s killing his on base percentage and it is 1.6 plate appearances better than Khris Davis who is sitting on an OBP 6.5% points lower.
Shifting his swing and using more of his leg strength to position himself better on pitches, has made an incredible difference for Yonder Alonso early in this season. While the home run numbers are unlikely to sustain at this pace, it’s not unreasonable to think that he could be a 30 home run hitter in 2017 and 40 home runs this season would actually surpass all of his other seasons combined.
Lastly, we’ll take a look at wins over replacement. This is where the numbers get small because Alonso has already matched his career high WAR season (1.5) from 2012. We’re going to break it down by game, though because many of his seasons fluctuated pretty widely from year to year. Below is Alsonso’s WAR per game played.
2012 – .009
2013 – .012
2014 – .015
2015 – .016
2016 – .001
2017 – .04
Although the numbers are small, it is easy to see a big jump in 2017. Plate discipline, an increase in home runs, and just general better baseball playing has made Yonder Alonso the most valuable batter on the A’s (with Jed Lowrie 0.2 behind him) thus far. This is an even greater improvement from 2016 than these numbers demonstrate as last season ended in a negative WAR.
Just for the sake of analysis, here are the projections on his stats based on 530 plate appearances. The WAR statistic is based on 155 games. These are not predictions, simply mathematical extrapolations to illustrate current success and would place Alonso among the most elite hitters in the game if they were reached but in terms of 32 games, there has never been a similar period in Yonder’s career that even approaches this success.
Home Runs – 52
Walks – 66
Strike Outs – 113
WAR – 6.2
Even if Yonder Alonso doesn’t stick to projections (which he won’t), his breakout success and recognition is nice to see. At age 30, after putting in the work and making the adjustments, Yonder Alonso is playing the best baseball of his career and any moderate sustaining of this success will serve the Athletics well in the 2017 season. Sadly, though, for A’s fans it will also make him a hot commodity around the trade deadline, especially if the AL Player of the Week finds himself in an All Star lineup come July. With free agency just around the corner, Yonder Alonso has picked a prime time to get hot and stay hot and it’s always nice to see good guys succeed.
Featured Image: 2017 Topps Gypsy Queen baseball card. Purchase the A’s team set on our store!


