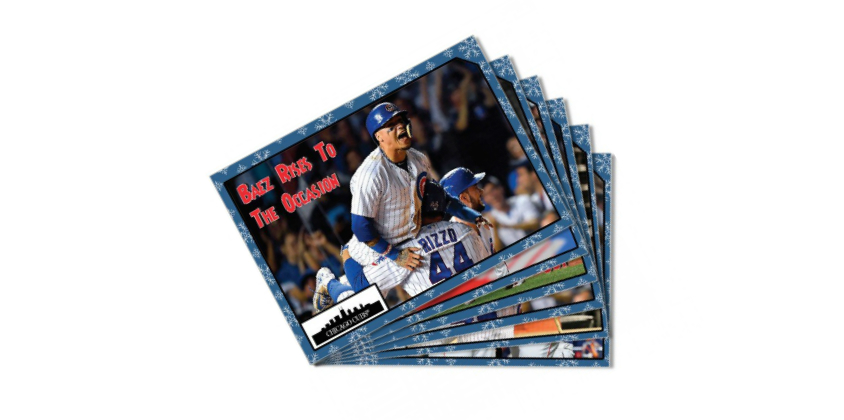
2017 Topps Throwback Thursday cards were another popular addition to the growing on-demand trading card marketplace and with a rookie class in high demand it is no surprise that these cards sold very well. Available for one week between Thursdays and featuring designs from all around the Topps library, these limited release cards saw significant growth over the 2016 edition in terms of print runs as well as final checklist size.
We have compiled a selection of stats of interest to collectors broken down by teams and players. In the interest of clarity, stats are limited to the top five or bottom five unless otherwise specified. Cards that contain two or more players are counted for each individual player’s stats but only once in overall print runs causing total percentages to skew slightly as two teams or two players can appear on one card. If you have any questions or would like stats added to these, please leave a comment at the bottom of this article. For a complete checklist, including print runs, please click the associated hub button at the top of this page.
Checklist Total – 185 Cards
Total Print Run – 130,710 Cards
Players Represented – 85
Teams Represented – 33
Highest Selling Set – 15, 1967 Fence Busters (2,245 Print Run)
Total Rookie Cards – 33
Aaron Judge – 14,036
Mike Trout – 8,327
Cody Bellinger – 7,568
Andrew Benintendi – 4,757
Mark McGwire – 4,529
Top 5 Card Apperances
Aaron Judge – 14
Mike Trout – 8
Cody Bellinger – 8
Jose Altuve – 8
Carlos Correa – 7
Top 6 Avg Print per Card
Albert Pujols – 1,569
Mark McGwire – 1,510
Ian Happ – 1,475
Trey Mancini – 1,475
Josh Bell – 1,329
Yoan Moncada – 1,329
Aaron Judge – 10.74%
Mike Trout – 6.37%
Cody Bellinger – 5.79 %
Andrew Benintendi – 3.64%
Mark McGwire – 3.46%
Total % of Card Appearances
Aaron Judge – 7.57%
Mike Trout – 4.32%
Cody Bellinger – 4.32%
Jose Altuve – 4.32%
Carlos Correa – 3.78%
Bottom 6 Avg Print per Card
Edinson Volquez – 289
Jon Lester – 289
Randy Johnson – 289
Miguel Cabrera – 309
Nori Aoki – 309
Xanxer Bogaerts – 309
Yankees – 18,719
Dodgers – 16,871
Astros – 15,081
Red Sox – 14,076
Cubs – 11,454
Top 5 Team Card Appearances
Astros – 29
Dodgers – 23
Yankees – 21
Red Sox – 19
Cubs – 16
Top 5 Team Avg per Card
Cardinals – 1,292
Braves – 1,189
Athletics – 1,111
White Sox – 1,022
Orioles – 965
Yankees – 14.32%
Dodgers – 12.91%
Astros – 11.54%
Red Sox – 10.77%
Cubs – 8.76%
Top 5 Team % of Card Appearances
Astros – 15.68%
Dodgers – 12.43%
Yankees – 11.35%
Red Sox – 10.27%
Cubs – 8.65%
Bottom 5 Team Avg per Card
Venezuela – 309
Netherlands – 309
Puerto Rico – 331
Japan – 331
Dominican Republic – 331
Brewers
Reds
Tigers
Cuba
Netherlands
Venezuela
Teams w/ 2 Cards
Cardinals
Braves
Giants
Rockies
Padres
Dominican Republic
Japan
Puerto Rico
Teams w/ 3 Cards
White Sox
Orioles
Diamondbacks
Mets
Expos
USA
Pirates
Mariners
Teams w/ 6 Cards
Athletics
Rangers
Teams with 8-10 Cards
Marlins (8)
Indians (9)
Nationals (9)
Angels (10)
Teams with 11-20 Cards
Cubs (16)
Red Sox (19)
Teams with 20+ Cards
Yankees (21)
Dodgers (23)
Astros (29)


